Climate is an important factor in plant ecology and evolution. To get a feel for some of the abiotic stressors of plant physiology and development, Walter and Leith climate diagrams can be informative.
How to making a climate diagram.
The first thing to do is to generate a table of the monthly average precipitation (mm), average maximum and minimum temperatures, and absolute minimum monthly temperatures of Medora, ND, which is where the park headquarters is located. I entered the data in excel and saved the file as a .csv.
To gather the numerical values needed, I collected historical weather data from the intellicast website. I needed to convert the precipitation to metric units, but that is not hard.
Then I ran the R code below to generate the diagram.
# Load Packages
library(tidyverse)
library(climatol)

# Make Walter and Leith Diagram
data <- read_csv("medora-historical-weather.csv", col_names = TRUE) %>%
  diagwl(est="Medora, ND",alt=691,per="1948-2018",mlab="en")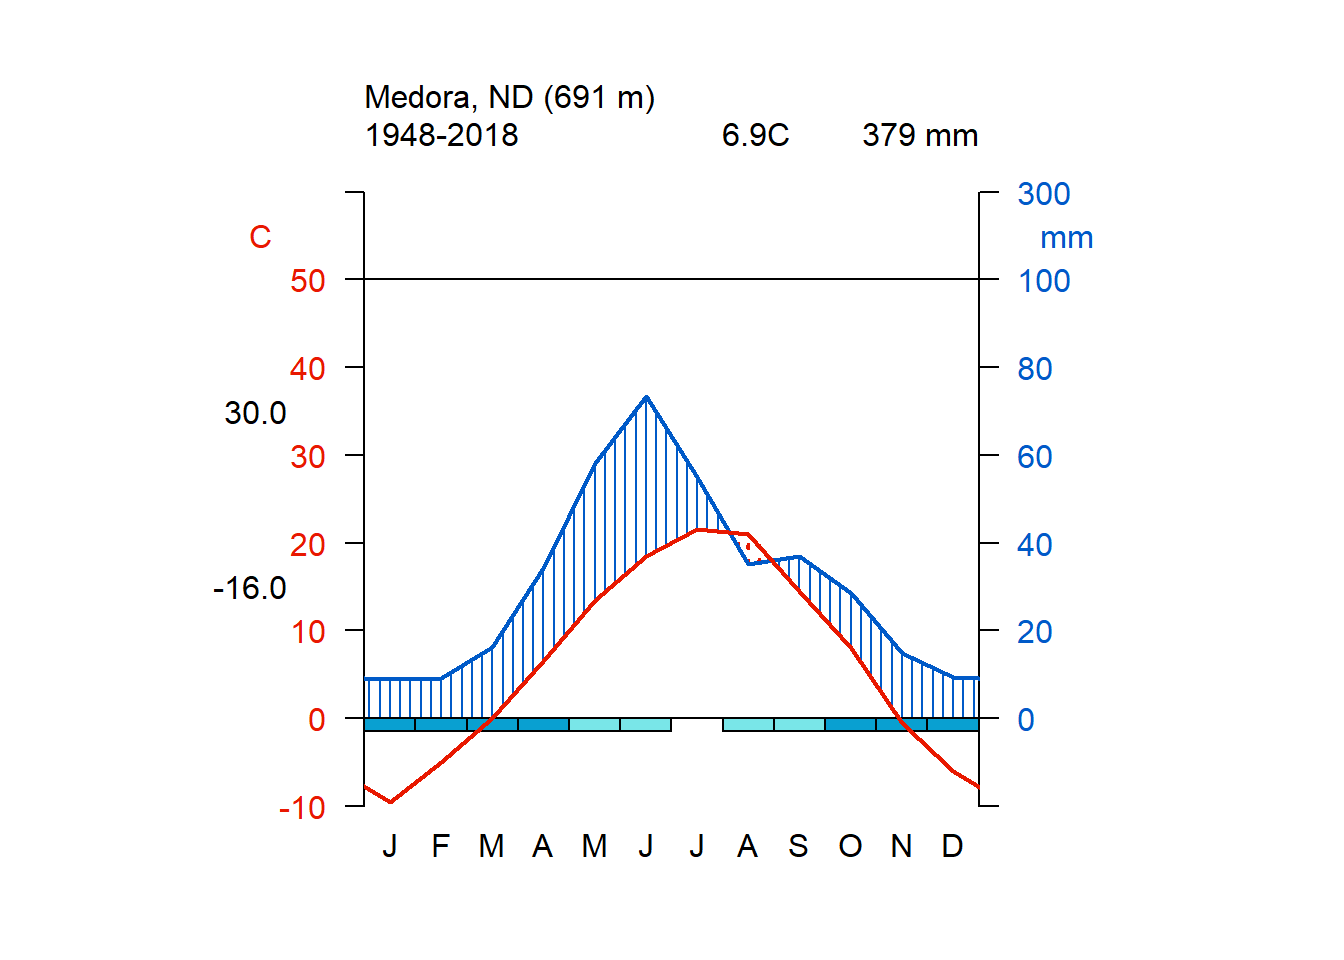
As you can see from the graph above, the growing season is about 7 months long, but below freezing temperatures can occur in June and August. The average temperature is 6.9 oC, which slightly warmer than a household refrigerator. The average high temperature of the year is 30 oC, and the average low temperature of the year is -16 oC. However, it can get as cold as -45 oC. The red line shows the monthly average temperature. The blue line indicates the average monthly precipitation and shows that the precipitation increases in the spring and then decreases as the year progresses. In August, dry conditions can limit plant growth. Consequently, plants that live in park need to have strategies to avoid or resist cold and dry conditions.